

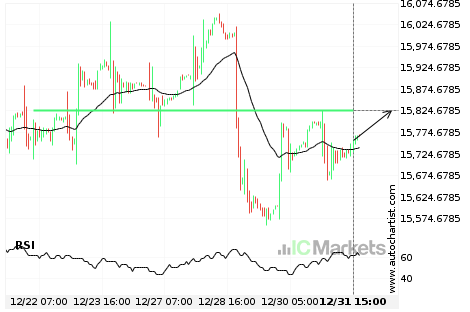
FTSE China A50 Index approaching important 15826.1201 price line
FTSE China A50 Index is approaching the resistance line of a Resistance. It has touched this line numerous times in the last 10 days. If it tests this line again, it could do so in the next 2 days.
FTSE China A50 Index approaching important 15826.1201 price line
FTSE China A50 Index is approaching the resistance line of a Resistance. It has touched this line numerous times in the last 10 days. If it tests this line again, it could do so in the next 2 days.
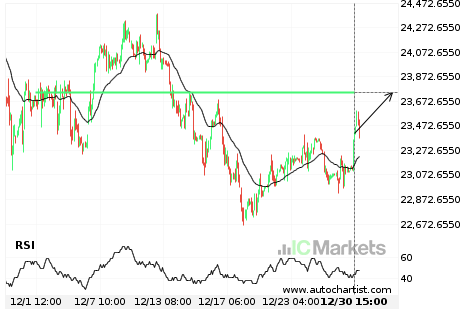
Should we expect a breakout or a rebound on Hong Kong 50 Index?
The movement of Hong Kong 50 Index towards 23740.9004 price line is yet another test of the line it reached numerous times in the past. We could expect this test to happen in the next 3 days, but it is uncertain whether it will result in a breakout through this line, or simply rebound back […]

Either a rebound or a breakout imminent on FTSE China A50 Index
FTSE China A50 Index is heading towards the resistance line of a Channel Up. If this movement continues, the price of FTSE China A50 Index could test 15801.1700 within the next 10 hours. It has tested this line numerous times in the past, so this movement could be short-lived and end up rebounding just like […]

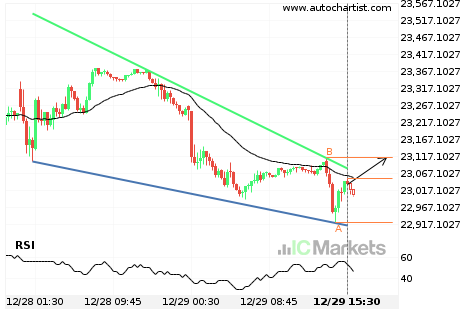
Will Hong Kong 50 Index have enough momentum to break resistance?
Hong Kong 50 Index is heading towards the resistance line of a Falling Wedge and could reach this point within the next 8 hours. It has tested this line numerous times in the past, and this time could be no different from the past, ending in a rebound instead of a breakout. If the breakout […]

Where is Australia 200 Index moving to?
A movement of 1.26% over 6 days on Australia 200 Index doesn’t go unnoticed. You may start considering where it’s heading next, a continuation of the current upward trend, or a reversal in the previous direction.

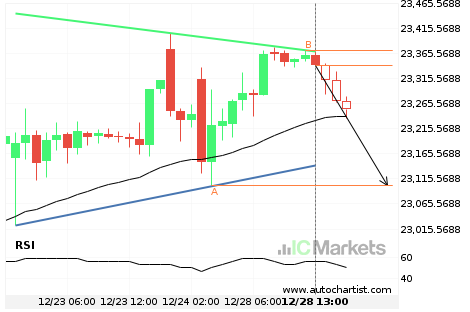
Will Hong Kong 50 Index have enough momentum to break support?
Hong Kong 50 Index is heading towards the support line of a Triangle and could reach this point within the next 6 hours. It has tested this line numerous times in the past, and this time could be no different from the past, ending in a rebound instead of a breakout. If the breakout doesn’t […]